Macro Intelligence & Equity Research
Economic calendar, FRED indicators, COT positioning, yield curves, stock screener, options chains, dark pool activity, and market movers — professional-grade analysis tools built into every dashboard.
Macro Analysis
A complete macroeconomic analysis suite integrated into the dashboard. Monitor the economic calendar, track FRED data series, analyze CFTC COT positioning, watch the yield curve, and follow commodity prices — all in one place, with a single click.
7 Macro Data Sources
From the economic calendar to commodity spot prices — every data point a macro trader needs, updated in real-time and accessible from one dashboard page.
Economic Calendar
High-impact events filtered by country and impact level — ISM, NFP, GDP, CPI, FOMC decisions. Know what moves markets before it happens.
FRED Charts
7 key economic indicators with interactive charts and range selectors (1Y/2Y/5Y/All): CPI, Core CPI, Fed Funds Rate, Core PCE, Unemployment, Industrial Production, Consumer Sentiment.
COT Report
CFTC Commitments of Traders across 12 markets — CAD, EUR, GBP, JPY, AUD, CHF, NZD, Gold, Silver, Crude Oil, Copper, USD Index. Non-commercial and commercial positioning with net position delta.
Yield Curve
Interactive US Treasury yield curve from 1M to 30Y. Spot inversions, monitor term structure shifts, and track recession signals in real-time.
Treasury Rates
Historical daily rates from 1M to 30Y with sortable columns and pagination. Track the 2Y-10Y spread — the most watched recession indicator.
GDP
US Real GDP from OECD with historical chart. Track economic expansion and contraction — GDP growth drives central bank policy and currency strength.
Commodities
Spot prices for WTI & Brent Crude, Natural Gas, Heating Oil, Jet Fuel, Gasoline, Diesel, and Propane. Sortable table with FRED symbol codes and units.
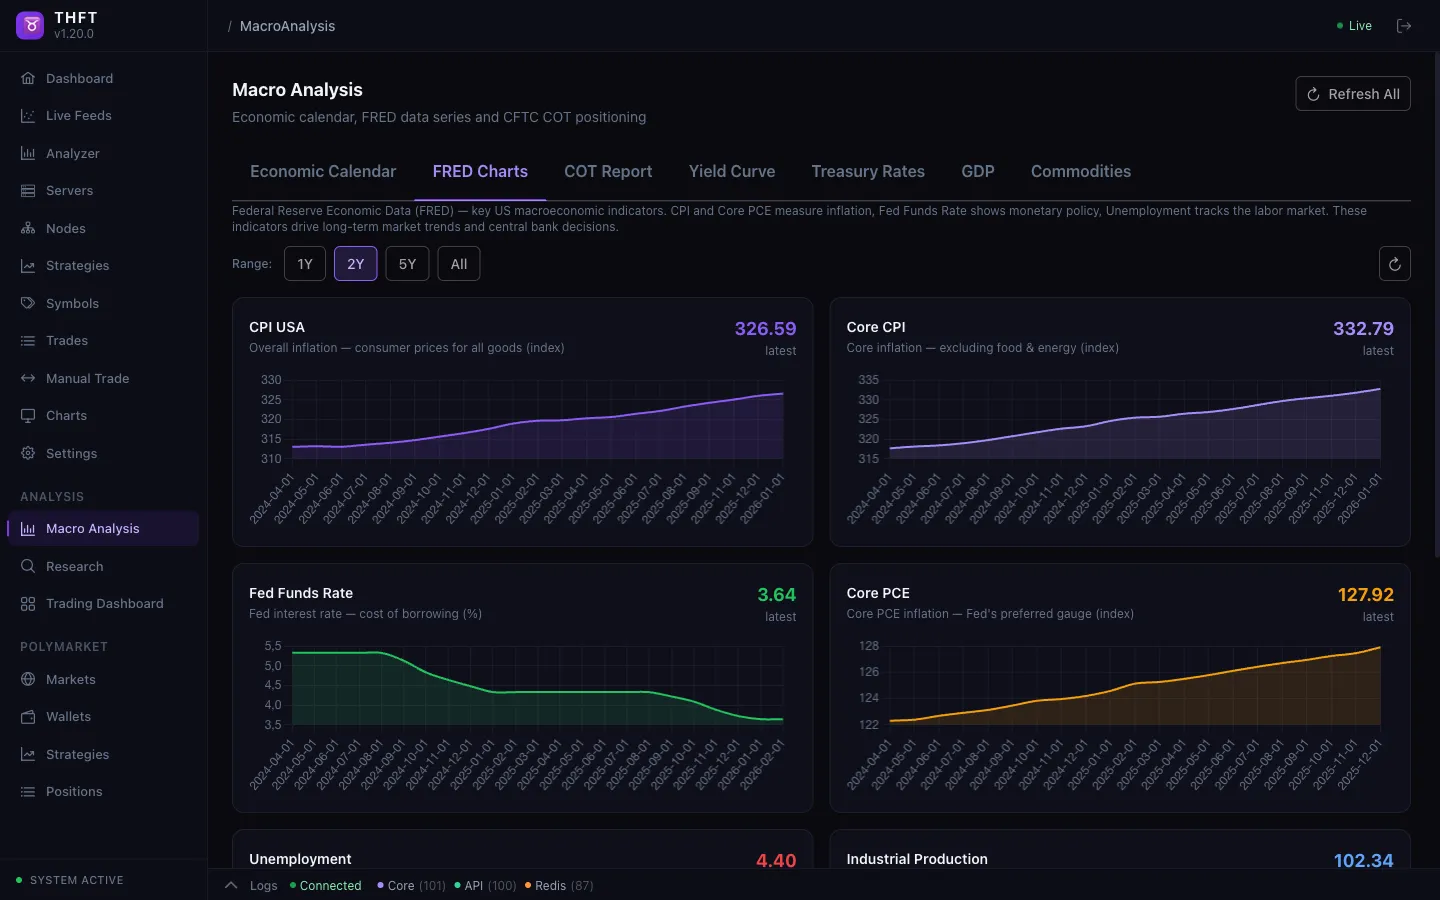
Dashboard — Macro Analysis (FRED Charts)
Equity Research
Screen stocks, analyze options chains with full Greeks, monitor dark pool activity from FINRA, read aggregated financial news, and track today's biggest movers. Deep-dive into any ticker with a 7-tab analysis covering fundamentals, financials, dividends, management, and short interest.
5 Research Tools
From stock screening to dark pool monitoring — institutional-grade research tools accessible from a single dashboard page.
Stock Screener
Screen equities by price, volume, market cap, P/E, EPS, dividend yield, and 52-week range. Sortable columns with real-time data. Click any symbol to open full analysis.
Options Chain
Full CBOE options data with Greeks — Delta, Gamma, Theta, Vega. Search by ticker, view all expiries and strikes with bid/ask, volume, open interest, and implied volatility.
Dark Pool
FINRA OTC transparency data — weekly share volume and trade counts for any ticker. Spot institutional accumulation and distribution patterns that don't appear on lit exchanges.
Financial News
Aggregated market news from Yahoo Finance, Motley Fool, Simply Wall St., and more. Filter by ticker or browse general market headlines. 80+ articles with source and timestamp.
Market Movers
Today's top Gainers, Losers, and Most Active stocks with price, change %, and volume. Click any symbol to open the full 7-tab ticker analysis with fundamentals, financials, and short interest.
Per-Ticker Deep Analysis
Click any symbol from the screener, market movers, or news to open a dedicated analysis page with 7 tabs covering every angle of the company.
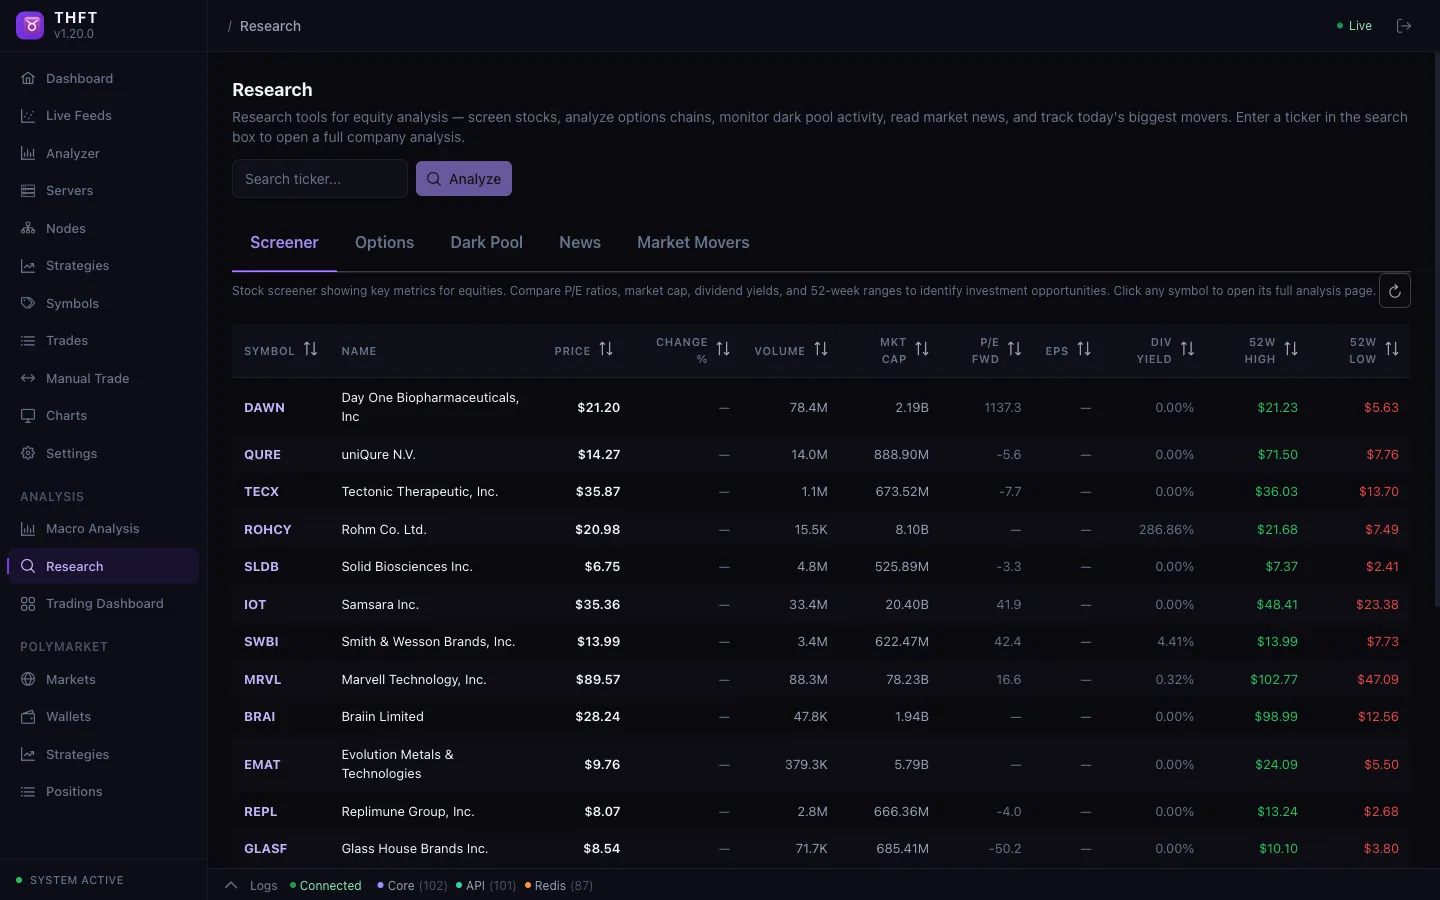
Dashboard — Equity Research (Stock Screener)
Watchlist & Market Overview
Build your personal watchlist with real-time prices and fundamental metrics. Get an instant snapshot of global market conditions — all auto-refreshing every 60 seconds.
Add any US equity ticker and track it in real-time with price, change %, volume, market cap, P/E, Beta, and 52-week range
Instant snapshot of global market conditions — indices, sectors, and key benchmarks at a glance
Upcoming and recent earnings reports with EPS estimates and actual results. Never miss an earnings surprise
SEC insider transactions — track what executives and directors are buying and selling in their own companies
Identify stocks with high short interest, low float, and rising volume — the ingredients for a short squeeze
All data updates automatically every 60 seconds — no manual refresh needed
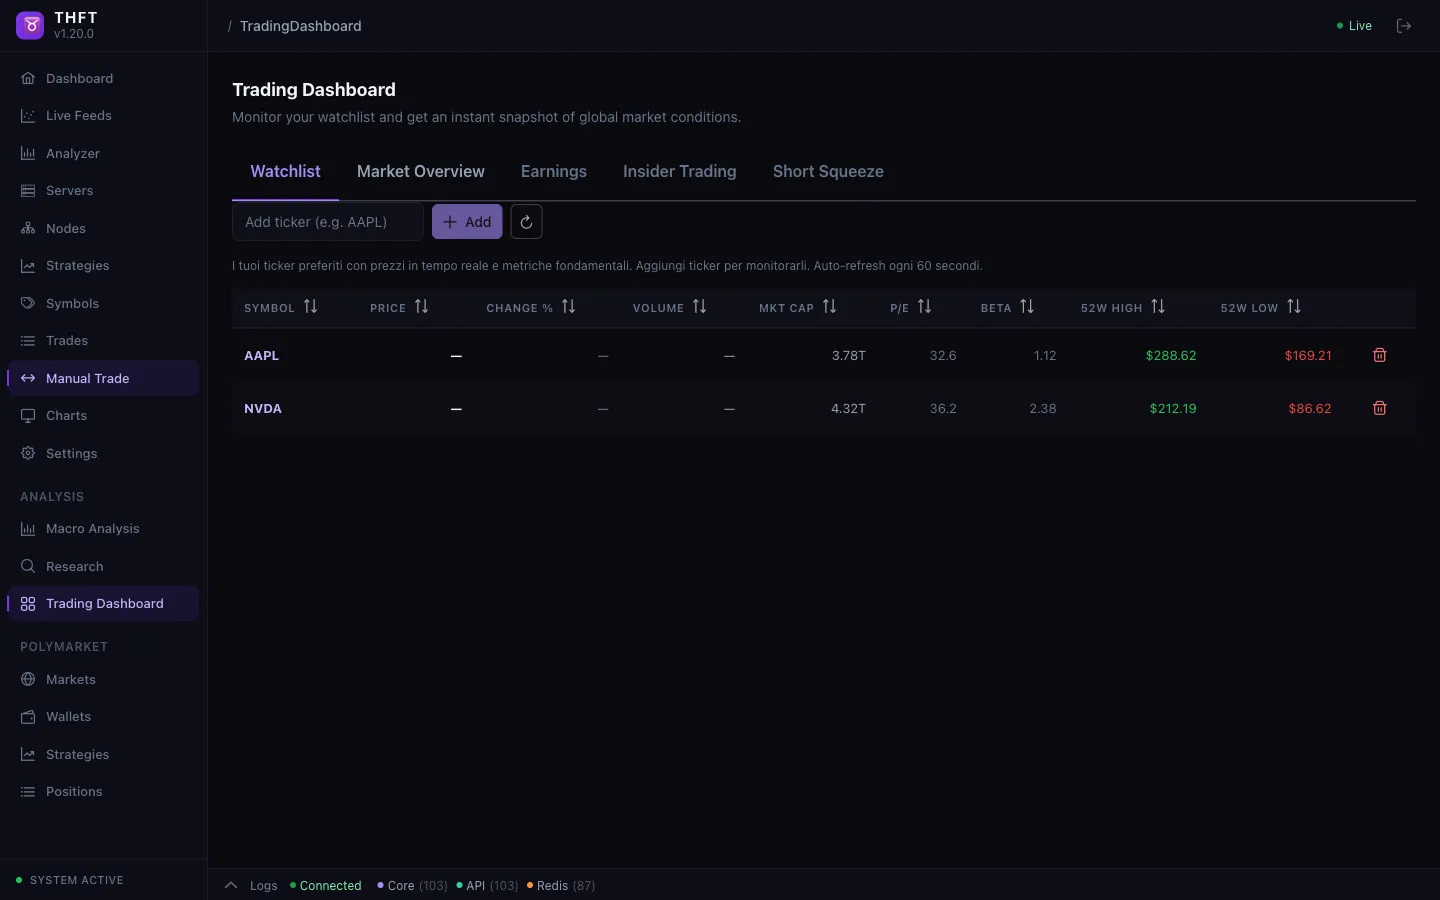
Dashboard — Trading Dashboard (Watchlist)
Ready to Get Started?
Get full access to the Taurus HFT engine, dashboard, and all strategies — $149/month.
Get Started